ERP dialog window tips
You can control X axis in the right panel as shown on the picture below, choosing the beginning and end of the time interval you want to see on a diagram.
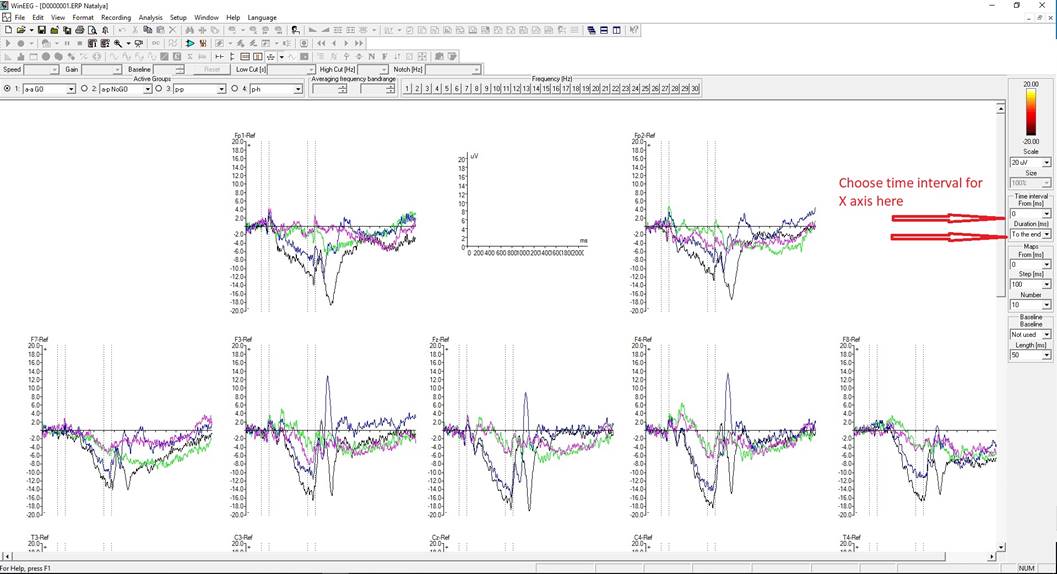
Two dashed vertical lines on the ERP plots mean the moments of appearance and disappearance of sound or image stimulus.
The structure of a single trial in the task is shown below
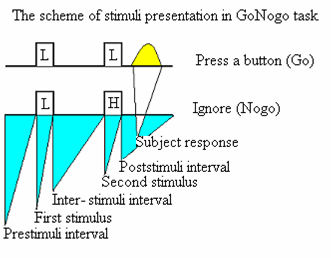
Pre-stimuli interval and other parameters are defined in Psytask software where you can set or change them.
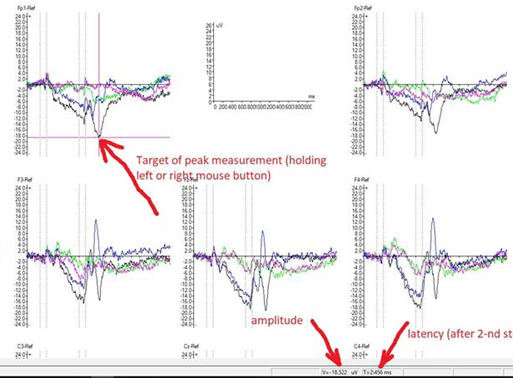
You can measure amplitude and latency of any point of ERP by moving the mouse cursor in the field of any diagram.
Amplitude and latency values will indicate in the bottom.
If you use right button of mouse, you can save these results.
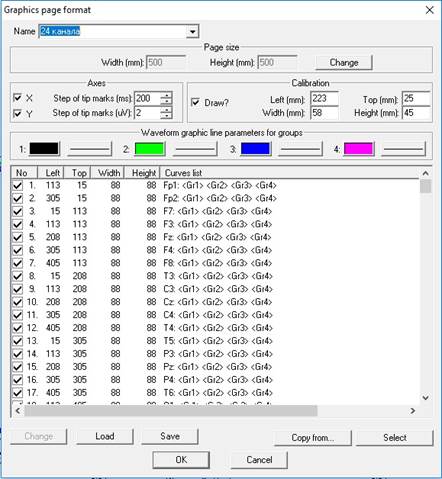
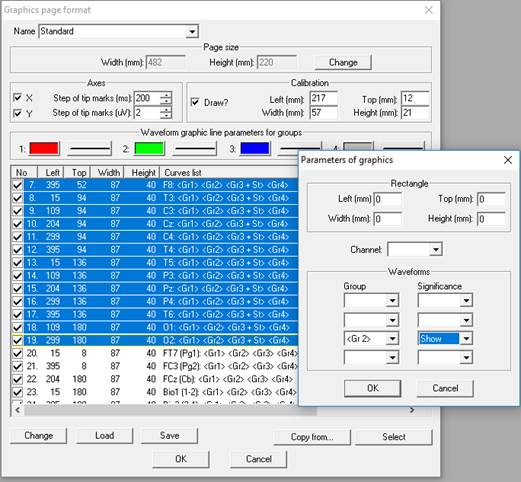
You can also change the scales of ERP graphs using MENU—Setup—Graph formats.
To add statistics scale to the plots, choose channels you need and click Change.
NB: You can Save you ERP’s to the separate database. To access it go to WinEEG-File-Open EEG Database… – ERP(EP) File.
To make a grand Average of ERP records you should select all the patient you want to average ERP(EP) File.
Then press AVERAGE button, specify necessary parameters and you get the results averaged for your group.